AF2BIND is a logistic regression model using AF2 features
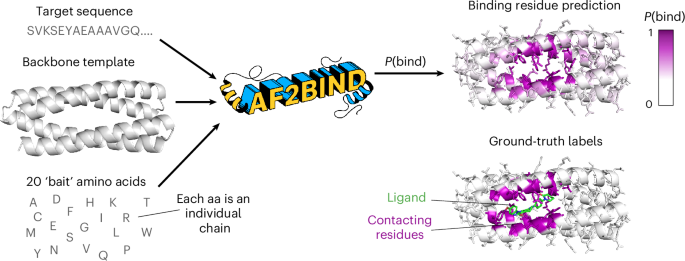
AF2BIND is a logistic regression model trained from AF2 pair features to predict each residue’s probability of contacting a small-molecule ligand, given a target protein structure (Fig. 1). The goal in our development of AF2BIND was to understand if features derived from AF2 provide a richer description for the small-molecule binding-site prediction task than previously used models. AF2 has already been used in predicting protein–protein and protein–peptide structures22,23,24, but it is less clear whether it could be useful for predicting small-molecule binding sites because small molecules are not explicitly modeled or accounted for in the training objective. Still, AF2 was trained on proteins that contain small molecules, and it sometimes even predicts the correct rotamers for binding, for example in metal or heme sites13, so some nuanced binding signatures might be embedded in its features that could be used to train a model for binding-site classification. Given that AF2, trained only on monomeric protein structures, can accurately predict protein–peptide co-structure with no co-evolutionary information of the peptide (and no examples in the training set)22,23,24, we reasoned that AF2 might also be useful for predicting small-molecule-binding sites, which often locally resemble amino-acid sidechains16 (Extended Data Figs. 1 and 2).

The inputs to AF2BIND are the target sequence, target backbone and 20 bait amino acids, which are surrogates for a small-molecule ligand. The output is a prediction for each residue of the target protein, P(bind), which is the probability that the residue is a small-molecule-binding residue. The model is trained on ground-truth labels from a couple thousand nonredundant protein–ligand co-crystal structures from the PDB.
We set out to train a binding-site prediction model that was maximally interpretable, with few operations that transform the AF2 embeddings. We chose a logistic regression model trained directly on AF2’s pairwise representation, which assigns a tensor to each pair of amino acids in an input sequence that is used to predict the relative position of these residues in the structure (Fig. 2a). We give AF2 the sequence of the target protein and its backbone structure as a template (we do not supply AF2 with a multiple sequence alignment). To allow AF2 to ‘finish folding’ the template protein, we also provide 20 disconnected ‘bait’ amino acids as individual chains, by appending these to the target sequence with large (50) residue offsets between each. Each of the canonical 20 amino acids is used. Instead of using multiple recycles, as is common for structure prediction, we only compute a single pass through the AF2 model to generate the pair representation. Our motivation is to extract the initial attention between target and ‘bait’ sequence, unbiased by arbitrary placement of ‘bait’ amino acids by the structure module. The pairwise embeddings between each of the 20 bait amino acids and a target residue are concatenated and fed into the logistic regression model for training, with the objective to predict the label for the target residue (1 or 0, whether it is a binding residue or not; Fig. 2a). AF2BIND thus takes a target sequence and backbone structure and computes a probability, P(bind), for each residue to participate directly in a small-molecule binding site (Fig. 1 and Methods). In addition to the per-residue binding-site prediction, the interpretable nature of the logistic regression model allows us to identify which bait amino acids are contributing to the sigmoidal activation of P(bind) (Fig. 2b).

a, The blue and green tensors represent the pairwise attention between target and 20 bait amino acids; these features are extracted, flattened and fed into a logistic regression model for binding-site prediction, P(bind). b, As the features directly map to the 20 bait amino acids, the contribution (activation) of each amino acid to the binding-residue prediction can be extracted.
Training of AF2BIND
To train AF2BIND, we created a rigorously split dataset of single-chain (<500 amino acids) protein–small-molecule complexes curated from the entire PDB. The split was based not only on sequence but also on fold, evolutionary classification and binding pocket similarity. This rigorous split is important for the binding prediction task because binding sites are highly conserved in proteins, even if the overall sequence diverges25,26. Our motivation was to prevent any leakage of the training data into the test data so we could accurately determine the ability of the model to generalize for de novo binding-site prediction. After creating this split, we found that regularization was still needed to keep from overfitting the model (Extended Data Fig. 3).
AF2 provides superior embeddings for binding-site prediction
Direct comparison of AF2BIND to other small-molecule binding-site predictors is challenging because most published train–test data splits contain considerable amounts of data leakage1,25,27,28. Instead, we compare the performance of different representations from various pretrained models for the binding-site prediction task on our train/test split. Our test set consists of 67 structures of diverse small-molecule binding proteins that share no structural, sequence or pocket similarity to any protein in the train or validation sets (see ‘Dataset’ and ‘Training’ sections in Methods for details). We compared the performance of AF2BIND with the single-representation features from AF2 (ref. 13), ESM2 (ref. 11) and ESM1-IF12 for just the target sequence or structure (no bait amino acids were included). Recently, ESM2 and ESM1-IF representations were used for binding-site prediction on a different train/test set29,30,31. We find the pair representation of AF2 outperforms these other representations for the small-molecule binding-site prediction task (Fig. 3 and Extended Data Fig. 4).

a, The average binding-site recovery on a tenfold cross-validation set given different representations as input to logistic regression. b,c, Binding-site recovery of test set between ESM2 and AF2-pair representations (b) and ESM1-IF and AF2-pair representations (c). Each point is a different target protein in the test set.
To assess model performance, we compute binding-residue ‘recovery’, the fraction of binding-site residues recovered from the top predictions, sorted by highest to lowest P(bind) (Methods). While the pair representation of AF2 provides the best singular embeddings for the binding-site prediction task (Fig. 3), a combination of AF2-pair and ESM embeddings provides the best metrics for recovery and receiver operating characteristic area under the curve (ROC AUC, Fig. 3a). The average recovery for binding-residue prediction was 66% for AF2-pair representation (AF2BIND) and increased only slightly to 68% and 69% when combined with ESM2 and ESM1-IF, respectively. We provide weights for the combined models in GitHub, but focus here on the AF2-pair representation, due to the interpretability of the bait residues in activation analysis and because the AF2 pair representation performed similarly to the combination models.
AF2BIND is well calibrated: the classifier threshold is roughly equal to the miss rate (1 – recall). For example, a classifier threshold of P(bind) = 0.1 misses approximately 10% of true binding residues, a threshold of 0.5 misses about 50%, and 0.9 about 90% (Extended Data Fig. 5). We use a threshold of 0.28 based on the Matthews Correlation Coefficient and F1 metric averaged across the ten cross-validation folds (validation sets). This threshold has a mean recall/sensitivity of 67%, false positive rate of 4.3% and precision of 63%. Performance on individual proteins across train, test and validation sets shows high specificity and sensitivity at this threshold (Extended Data Fig. 6). For the task of de novo binding-site prediction across entire proteomes (see below), we require a low false positive rate because the expected label distribution is imbalanced (for example, only 10% of residues in the training set are binding residues). The mean MCC/F1 threshold satisfies our requirements of high recall and precision.
Exemplar performance of AF2BIND on held-out protein classes
AF2BIND can accurately predict binding residues of rigorously held-out protein classes. We held out G-protein coupled receptors and bromodomains (as well as other classes) from training and validation, based on sequence similarity and structural similarity (Methods). AF2BIND confidently predicts the binding residues of these proteins (Fig. 4). Not every residue in the binding site is predicted with equal probability, providing a hierarchy of residues most likely involved in binding a small molecule. This ranking scheme gives additional information over volumetric pocket-finding algorithms6,8, as it suggests which residues might preferentially engage a ligand. P(bind) is not trivially correlated with conservation (Extended Data Fig. 7), as shown by the low conservation in the orthosteric binding site of the mu opioid receptor relative to the more conserved intracellular core and G-protein-binding regions (Extended Data Fig. 7c,d). Furthermore, slight variations in the protein backbone lead to reproducible predictions (Extended Data Fig. 7b). For example, four structures of the human mu opioid receptor were compared, with average backbone root mean square deviation (RMSD) of 0.7 Å. The spread (s.d.) in P(bind) for each residue was very low (0.02), and the variance did not correlate with the magnitude of P(bind). Because we mask the sidechain dihedral angles of the input template of the target protein, AF2BIND is insensitive to the sidechain rotamers of the target protein, which is advantageous if the rotamers are uncertain (common for predicted protein structures). Indeed, we found that masking the sidechain dihedrals of the holo structures during training led to equal (or even slightly better) predictive power (recovery) of the model, relative to a model trained with the additional sidechain information given to AF2 (Extended Data Fig. 8). Because one of the most common differences between unbound and bound structures of proteins is the change of a rotamer in a binding-site residue32, this insensitivity to sidechain coordinates should prove beneficial when analyzing unbound or ambiguous structures. Moreover, changes in backbone coordinates between unbound and bound states are on average small (RMSD < 1 Å), within the range where predictions by AF2BIND are robust.

a,b, Per-residue binding-site predictions of the human mu opioid receptor (PDB 8EF5) bound to fentanyl (a) and of the second bromodomain of human BRD4 (PDB 7RUH) bound to an inhibitor (b). AF2BIND never saw a G-protein coupled receptor, bromodomain or similar proteins during training. The highly accurate predictions were made without knowledge of the bound ligand. The color scale of the binding probability, P(bind), scales from white (P(bind) = 0) to purple (P(bind) = 1).
To probe further the sensitivity of the model on backbone, we tested AF2BIND on a set of proteins that display larger-scale changes in backbone conformation upon binding. We used the Binding MOAD (Mother Of All Databases) database32 of matched apo/holo structures to find unbound and bound pairs of identical proteins with Cα RMSD greater than 1 Å and less than 3 Å. We grouped matched pairs by family and chose a representative pair from each with the highest Cα RMSD. The resulting ten pairs show a high Spearman correlation in P(bind) and similar recovery, showing that AF2BIND is robust to larger structural changes that are sometimes associated with small-molecule binding (Supplementary Table 1).
We next performed an analysis on three proteins that undergo very large-scale (>3 Å) structural changes between bound and unbound states. AF2BIND showed similar high recovery on both bound and unbound states of adenylate kinase, maltose-binding protein and calmodulin, despite the massive changes in structure after binding (Extended Data Fig. 9). While these results are encouraging, we note that AF2BIND was not as successful at recovering binding residues in cases of binding-site collapse in the unbound state, as in the cryptic site in β-lactamase (Extended Data Fig. 10). Here, a helix, which moves outward to expose a pocket in the bound state, is packed against the protein in the absence of the ligand. Consequently, AF2BIND does not predict the residues of the helix in the unbound state as ligand binding. In summary, AF2BIND shows a remarkable amount of robustness to structural changes, but might struggle in structures that harbor collapsed binding sites, a case outside its training regime.
Contributions of bait residues correlate with ligand hydrophobicity
Because AF2BIND uses a linear combination of AF2 pair features, the contribution of each of the 20 bait amino acids to the binding-residue prediction can be uniquely attributed (Fig. 2b). The ease of this assignment is a distinct advantage of the logistic regression model. For each of the ~2,000 structures from our dataset, we analyzed the propensity of the bait amino acids to contribute to P(bind) as a function of polarity (fraction of carbon atoms) of the true ligand from the crystal structure (Fig. 5). We found that certain bait residue combinations were negatively and positively correlated with ligand hydrophobicity (Fig. 5a,b, respectively). This activation analysis represents a possible small-molecule ligand as a linear combination of the 20 amino acids (for example, Extended Data Fig. 2). As illustrative examples, hydrophobic bait amino acids predominately contribute to the binding-site prediction of the supernatant protein factor (PDB 4OMJ), which binds the hydrophobic terpenoid, 2,3-oxidosqualene (Fig. 5c). On the other hand, hydrophilic bait amino acids are the main contributors to binding-site prediction for the 4-diphosphocytidyl-2C-methyl-D-erythritol kinase (PDB 2V2Z), which binds the polar substrate, 4-diphosphocytidyl-2C-methyl-D-erythritol (Fig. 5d). Thus, bait activation analysis offers a chemical fingerprint by which to further classify the nature of a predicted small-molecule binding site.

a, We performed an activation analysis across all 1,896 proteins and their respective bound ligands in our dataset. We found that a group of bait amino acids, FSIT, were activated inversely proportional to ligand hydrophilicity (computed as the number of non-carbon atoms in a ligand). These residues showed the highest Pearson correlation with ligand hydrophobicity. b, We found that a pair of bait amino acids, HE, activated proportionally to ligand hydrophilicity. This bait pair of residues showed the highest Pearson correlation for this metric. c, Bait activation analysis of predictions for transport protein (PDB 4OMJ). The small-molecule ligand (green, chemical structure shown at bottom) has a high fraction of carbon atoms, and the dominant bait amino acids that were activated were W and F. d, When the fraction of carbon atoms in a ligand decreases (PDB 2V2Z), the activation value of W and F drops, and that of polar amino acids (such as Q and N) increases. Data in a and b are presented as mean ± s.d. over predictions of AF2BIND (seed = 0) for the 1,896 proteins in our dataset.
Correlations in features
To predict P(bind) for a target residue, AF2BIND takes as input 5,120 pair features from AF2 (20 baits × 256 pair features). We analyzed the 5,120 features using principal-component analysis (PCA) and found that the top 1,020 of 5,120 principal components were necessary to account for 95% of the variance in the data (Supplementary Data Fig. 1). Thus, many features in the pair representation of AF2 are correlated and could perhaps be dropped without a noticeable loss in prediction accuracy; however, because the logistic regression computation is quite fast, we choose to keep all features in the final model instead of only the first 1,020 principal components.
We next wondered if all 20 bait residues were necessary for the predictions. We performed PCA on the pair representation between each target protein residue and the 20 bait residues (Supplementary Fig. 2). We used the 20-bait dimension of the pair features and stacked the 256-pair-embedding dimension as samples. PCA on this matrix gives 20 principal components as linear combinations of the bait features. We found 17 of 20 principal components were required to explain 95% of the variance, showing that most bait amino acids are indispensable for the predictions (Supplementary Fig. 2a). Composition analysis of the principal components provides insight into the dominant types of interactions used for AF2BIND predictions (Supplementary Fig. 2b–d). The first principal component (21.9% of explained variance) shows globally correlated baits with top baits spanning a variety of size, aromaticity and polarity. The dominant baits of the second principal component (12.67% of explained variance) show polar groups (N, Q, S and T) anti-correlated with apolar groups (W, F, I and M). The third component (9.47% of explained variance) has major contributions from charged residues, with opposite charges showing strong anti-correlation (E and D versus R and K). Thus, the baits seem to be used according to their biochemically similar features, with polar versus apolar features accounting for most variance.
In a complementary analysis of bait redundancy, we analyzed the bait activations themselves (for each target residue there are 20 bait activations). We performed a Spearman correlation analysis across all bait activations in the test set (a total of n = 21,322 residues across 67 proteins) (Supplementary Fig. 2e). While no pair of baits show a Spearman correlation higher than 0.6, the Spearman matrix shows that biochemically similar amino acids activate together: hydrophobic baits, similarly charged bait and neutral polar baits. Only the activation of the Cys bait shows no correlation with activation of any other bait residue.
Prediction of binding sites across the human proteome
We used AF2BIND to predict binding sites across the AF2-predicted human proteome21. In the AF2 structural database, each protein is predicted as a single chain, despite many being part of higher-order biological assemblies. While some interchain binding sites will be missed due to modeling single chains only, single-chain AF2 predictions often resemble the structure of the chain within the (missing) assembly, so these single-chain structures can still be biologically relevant. We trimmed low-confidence (low pLDDT) regions of the AF2-predicted chains and split larger multi-domain chains into pairs of contacting domains (Methods). AF2BIND predictions of small-molecule binding residues (above the classifier threshold of 0.28) were clustered into multi-residue (>4 residues) binding sites based on spatial proximity (Methods). AF2BIND predicts 20,302 binding sites within 13,686 proteins in the human proteome (Fig. 6). Of these sites, 15,755 have no overlap with any ligand-binding residues assigned by AlphaFill4 (6 Å heavy atom distance), which uses bound small molecules from homologous PDB structures to ‘fill in’ unliganded pockets. Thus, many AF2BIND-predicted sites are not trivially assigned by homology (Fig. 6b).

a, Venn diagram of predicted binding sites across the AF2-predicted human proteome using AF2BIND (blue), P2Rank (red) and AlphaFill (green). Inset numbers denote number of shared or unique sites. A site was considered shared between methods if it contained one or more identical residue. Note that the sum of inset sites within a given method does not necessarily sum to the total number of sites predicted by that method because multiple sites of one method may map to the same site of another method. Empirically, AlphaFill-only sites seem to be spuriously assigned by AlphaFill and are artifacts of the site-transfer method. b, Examples of sites uniquely predicted by AF2BIND (blue region in a). Residues with P(bind) > 0.28 are shown in magenta sticks. Considering only sites that had no overlap with P2Rank or AlphaFill, the top 100 sites by AF2BIND CDF z-score were selected and subsequently ranked by Dscore. The top three sites with highest Dscore after this rank-ordering are shown. Some residues in the labeled ranges are omitted for clarity. c, Dscore distributions of binding sites predicted across the human proteome by AF2BIND and P2Rank, as well as for the subset of the proteome represented in Morbid Map (Online Mendelian Inheritance in Man; OMIM). Median Dscore is labeled to the right. Horizontal lines denote quartiles of the distributions. The number of AF2BIND sites assessed by SiteMap (blue) was 19,250 for entire human proteome and 5,835 for Morbid Map proteins (OMIM). The number of P2Rank sites assessed by SiteMap (red) was 25,301 for entire human proteome and 8,420 for Morbid Map proteins (OMIM). In a–c, AF2BIND and P2Rank sites used in analysis had AF2BIND cdf z-score >0.05 and P2Rank probability >0.05, respectively.
We compared AF2BIND with a popular binding-site prediction tool, P2Rank5, a random forest classifier of probe points decorated around a protein surface. P2Rank uses a clustering algorithm to assign a pocket probability to densely clustered solvent-accessible surface points, and the nearest residues to the clustered points become pocket residues. We compared binding-site residues assigned by AF2BIND with binding-site residues assigned by P2Rank (Fig. 6a). For sites assigned with greater than 5% confidence/probability (Methods), AF2BIND predicts 9,732 sites distinct from P2Rank, including over 4,900 proteins where P2Rank does not predict any site. Conversely, P2Rank predicts 8,408 sites distinct from AF2BIND, including over 700 proteins where AF2BIND does not predict any site. When combined, AF2BIND and P2Rank predict nearly 29,000 unique sites within 15,026 proteins, with nearly 11,000 sites shared between the two methods.
Quality of predicted sites
We compared the quality of pockets identified by AF2BIND and P2Rank across the AF2-predicted human proteome. We used Dscore from SiteMap33, which is a weighted sum of the size, enclosure, and hydrophilicity of the site, to assess druggability of the predicted sites. Both AF2BIND and P2Rank predict sites with median Dscore above a commonly used druggability threshold33 (0.83), indicating that both methods identify promising sites for drug discovery (Fig. 6c). On average, sites from AF2BIND exhibited less enclosure and higher exposure than P2Rank sites, and both methods predicted sites with similar ratios of H-bond donors to acceptors (Supplementary Fig. 3). Predictions grouped by Evolutionary Classification of Protein Domains (ECOD)34,35 homology group (H-group) showed some of the most druggable classes of proteins (Supplementary Fig. 4), as well as the relative druggability of the most frequently occurring H-groups with predicted sites (Supplementary Fig. 5).
We computed two ranking schemes for AF2BIND-predicted sites. The first is a cumulative density function over z-scores of the mean P(bind) of each residue in the site (Methods). The second is a simple sum of the top N residues in the site by P(bind) divided by N. We found that N = 23 (accounting for 75% of all binding sites in training) gives the best Spearman correlation with P2Rank probability and with Dscore (if a site has less than 23 residues, we still divide by 23) (Supplementary Figs. 6 and 7). Indeed, this simple metric has a higher Spearman correlation with Dscore (0.40) than does P2Rank probability (0.31) (Supplementary Fig. 6). This is perhaps not surprising, as most small molecules in the training set (640 of 947) obey Lipinski’s rule of 5, suggesting that P(bind) might correlate with druggability due to the slight bias in sites seen during training.
Morbid Map analysis
Finally, we compared AF2BIND and P2Rank predictions against disease-relevant proteins found in the Morbid Map database36. The distributions in Dscore of the predicted sites in Morbid Map proteins are similar (slightly higher) to those in the entire proteome (Fig. 6c and Supplementary Fig. 8). Of the ~5,700 proteins contained in Morbid Map, AF2BIND predicts small-molecule binding sites in 3,556 proteins, 527 of which have no site predicted by P2Rank. Indeed, 411 Morbid Map proteins with sites predicted by AF2BIND have no shared site with AlphaFill or P2Rank. Conversely, P2Rank predicts sites in 3,347 proteins, 318 of which are unique to P2Rank. Altogether, AF2BIND and P2Rank predicted binding sites in a shared set of 3,029 proteins and a total combined set of 3,874 proteins. Over 950 distinct binding sites were predicted by AF2BIND with no overlap with AlphaFill or P2Rank. These results underscore that AF2BIND is providing new information not already covered by pocket predictors or homology modeling, doing so in disease-relevant proteins.
AF2BIND can predict shallow sites
It is interesting to dissect where AF2BIND predictions diverge from P2Rank predictions. In general, P2Rank assigns sites that are predominantly recessed pockets (Supplementary Fig. 3). While AF2BIND also predicts binding residues in recessed pockets, predictions from AF2BIND that are missed by P2Rank are often shallower, more surface-exposed sites, sometimes without a noticeable pocket. Examination of some of these sites shows RNA-binding or peptide-binding functionality. For example, the microtubule binding subunit of dynactin (UniProt Q14203) contains a CAP-Gly domain that binds to the C terminus of peptides, including the zinc finger domain of ClipZn2 (PDB 2HQH) and the plus end of microtubules (Supplementary Fig. 9a). Because this site interacts predominantly with only three C-terminal residues in the peptide (as opposed to more extensive protein–peptide interactions seen for peptide binding), it contains some small-molecule binding character and is predicted with high confidence by AF2BIND. In another example, AF2BIND predicts a site within the protein telomerase (UniProt O60832) at a protein–RNA interface (PDB 8OUE; Supplementary Fig. 9b). Finally, prediction of a binding site within pituitary-specific positive transcription factor 1 (UniProt P28069) occurs at the diffuse protein–DNA interface (PDB 5WC9; Supplementary Fig. 9c). As the model was only trained to predict small-molecule binding sites, AF2BIND in these cases is predicting nucleic-acid- and peptide-binding sites that share some common features with small-molecule binding sites. The AF2 pair features that distinguish sites for these classes of ligands can be thought of as on a continuum; here, AF2BIND highlights some functional biopolymer binding sites that might indeed be ligandable by small molecules. Note that the logistic regression model was not trained to suppress recovery of peptide- or nucleic-acid binding sites, so it should be possible for AF2BIND to predict some of these sites as small-molecule binding to the extent that they share similar AF2 pairwise embeddings as small-molecule binding sites. Identification of sites such as these that involve other biomolecules and yet might be addressable by small-molecule ligands, using only single chains as input, could be particularly advantageous due to the prohibitive cost of enumerating all possible molecular bioassemblies. Indeed, AF2BIND does predict some sites of known protein–protein interactions where small-molecule inhibitors have been found to bind (for example, menin and MCL1), although it misses a liganded site in interleukin (IL)-2 with a very shallow groove (Supplementary Fig. 10).
Predicting allosteric versus orthosteric sites
We trained AF2BIND on a set of 1,897 single-chain proteins (<500 residues) that are diverse in sequence, structure and binding pockets. Most of these sites are orthosteric (functional sites where endogenous ligands bind), which mirrors the trend in the PDB overall. A literature analysis37 of allosteric small-molecule binding sites in the PDB found ~2,700 structures (approximately 1.4% of all deposited structures). Only 23 PDBs in our dataset (1.2%) overlapped with this allosteric set, tracking the background distribution of allosteric proteins in the PDB. Despite the underrepresentation in training, we assessed performance of AF2BIND on allosteric sites in the AF2BIND dataset. AF2BIND predicts sites in most of the (few) allosteric proteins in the training set, and it recovers sites in the two allosteric proteins in the test set (Supplementary Fig. 11a). AF2BIND is slightly less calibrated for allosteric proteins: the classifier threshold does not coincide with the miss rate as strongly as for orthosteric sites (Supplementary Fig. 11b versus Extended Data Fig. 5a), although the ROC AUC on the small allosteric set of proteins is still high (0.91).
We next sought to understand AF2BIND performance on allosteric sites without the bias that comes with using structures that have allosteric ligands already bound. To do this, we used a subset of AF2-predicted (ligand-free) human proteins with UniProt accessions in the allosteric list of PDB proteins, resulting in a total of 39 AF2-predicted structures. Of these, AF2BIND predicted two-thirds of the allosteric sites, showing that it can indeed identify these sites, even in AF2-predicted ligand-free structures (Supplementary Fig. 12a). A structural comparison of the AF2-predicted structures versus the corresponding structures in the PDB showed a wide range of RMSD differences (0.5–5 Å), which did not correlate with prediction success (Supplementary Fig. 12b). For example, in PARP14 macrodomain 2, an allosteric ligand bound in the crystal structure displaces a loop in the AF2-predicted structure (Supplementary Fig. 12c, inset, overall Cα RMSD 1.9 Å). Despite the loop occluding the pocket, AF2BIND successfully predicts this allosteric site using the AF2 structure as input. Despite this success, we do not expect AF2BIND to perform well in all cases for allosteric binding. Indeed, performance appreciably declines when the site is completely collapsed (cryptic), as in β-lactamase (Extended Data Fig. 10), suggesting room for improvement in future models.
AF2BIND predictions synergize with chemoproteomics
Emerging datasets from chemical proteomic studies have identified hundreds of small-molecule binding sites across diverse proteins in human cells. We sought to cross-reference predictions from AF2BIND and P2Rank against this body of data. Overlapping predictions from AF2BIND or P2Rank might provide impetus for subsequent, focused experimental efforts. Alternatively, discrepancies between experiment and prediction may illuminate areas for future model improvement. We used a proteome-wide cysteine profiling dataset38 from Cravatt and co-workers to find predicted binding sites nearby experimentally liganded cysteines. Using AF2-predicted single-chain structures, we considered a site as plausible for the Cys liganding event if a residue’s Cα atom was within 12 Å of the Cys sidechain (heavy atoms). Of 212 separately liganded tryptic peptides (featuring 271 cysteines), AF2BIND predicted binding sites near 78 of them (~1 in 3 success rate) (Supplementary Fig. 13). P2Rank predicted binding sites near 84 of them (~1 in 3 success rate). AF2BIND found nearby sites in 18 proteins that P2Rank missed, and P2Rank found nearby sites in 23 proteins that AF2BIND missed. Combined, AF2BIND and P2Rank predict sites near almost half (n = 102) of the liganded peptides. These results reinforce that the two methods can be used in concert to good effect. While encouraging, the results also suggest shortcomings in the modeling of current AF2-predicted structures (for example, the absence of binding partners or modeling of a higher-order oligomeric state) or deficiencies in the binding-site predictors themselves, for example with predicting cryptic sites that are not readily distinguishable in a predicted structure (no apparent pocket). Still, AF2BIND shows some promise despite these shortcomings; using only the single-chain AF2-predicted structure, it predicts a site in FOXA1 that, from the crystal structure, seems to be driven by a biomolecular complex with DNA (Supplementary Fig. 13c).