Retrospective standalone evaluation
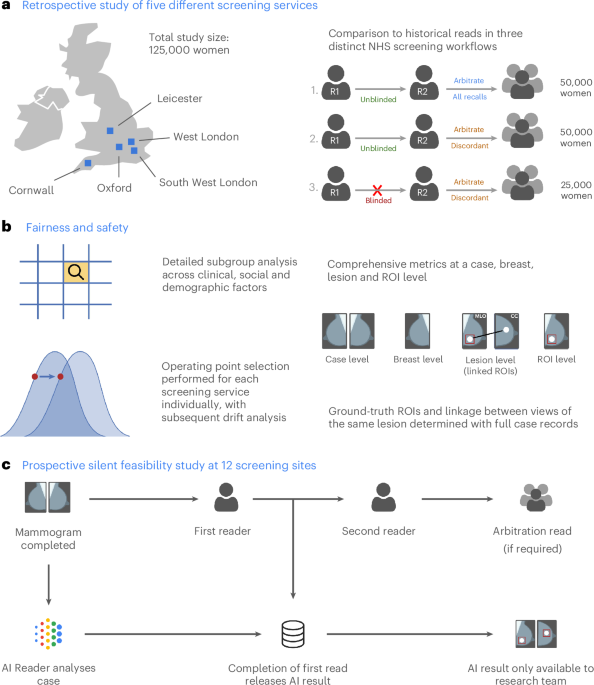
The retrospective evaluation covered five breast screening services from across the UK, representing three distinct clinical workflows, including 125,000 women aged 50–70, who were screened in 2015–2016, as summarized in Table 1. The final analysis included 115,973 women after applying inclusion and exclusion criteria (Extended Data Fig. 1a and Supplementary Table 1).
AI achieved superior sensitivity and noninferior specificity for cancer detection
The AI system achieved superior sensitivity and noninferior specificity to first reader, second reader and consensus decision after arbitration, at a case and breast level (noninferiority margin: 5%, P < 0.001 for all; Fig. 2a,b). Across all services, AI cancer detection rate (CDR) was higher versus the first human reader (9.33 per 1,000 women, 95% confidence interval (CI): 8.78, 9.88) versus 7.54 per 1,000 women, 95% CI: 7.04, 8.03), although the AI recall rate was higher than the first reader (6.5%, 95% CI: 6.4, 6.7 versus 5.5%, 95% CI: 5.3, 5.6). Performance was sustained across all five services, despite varying cohorts and clinical screening practices (Fig. 2c). Full results are presented in Supplementary Tables 2 and 3.

a, Sensitivity and specificity at a case (n = 115,973), breast (n = 231,268) and lesion (n = 681) level. *Noninferior, P < 0.001; +superior, P < 0.001. A Wald test was used for noninferiority, Obuchowski’s extension of the two-sided McNemar test was used for superiority at the case level and bootstrap-based tests were used at the breast level. Statistical testing was performed using one-sided tests at the 0.025 significance level (after correcting for multiple comparisons). For the primary endpoint of AI against first human read, sensitivity was superior at P = 2.8 × 10⁻¹⁶, while specificity was noninferior with P = 6.1 × 10−181. Shaded columns represent the prespecified 5% noninferiority margin. †Historical human readers did not mark lesions digitally; thus, we were only able to plot AI results. Ground-truth lesion ROIs were only available for services 1 and 2, where the case-level sensitivity was 0.61 for comparison. It was not possible to label 5.4% (39/721) of interval or next-round cancers because of missing records. b, ROC plot showing breast-level (orange; n = 231,268) and case-level (blue; n = 115,973) results for the first, second and consensus screening decision against the AI read. c, Case-level performance for the five screening services as measured by recall rate and CDR (n = 115,973). Lines for each service represent the range of possible AI OPs, with the study-selected threshold marked (squares). Error bars represent the 95% CIs. d, CDR against recall rate for all five screening services combined at a case level, split by prevalent screens (women’s first screens) and incident screens (screens where prior imaging exists); n = 115,973 total screens, 16,104 prevalent screens and 99,869 incident screens. Error bars represent the 95% CIs.
The AI system demonstrated lesion-level sensitivity of 0.550 (95% CI: 0.512, 0.588) (Extended Data Fig. 2a). There was no comparator for human reads, as specialists do not routinely mark suspicious lesions on screening images in a digital form. For the best comparison, case-level sensitivity was 0.61 for the same two sites.
To facilitate comparison to studies that do not consider interval cancers in their ground truth, the AI system achieved case-level sensitivity of 0.913 (95% CI: 0.895, 0.932) and specificity of 0.941 (95% CI: 0.940, 0.942), with an area under the receiver operating characteristic (ROC) curve (AUC) of 0.978 (Extended Data Fig. 2b,c) when considering screen-detected cancers only.
AI outperformed for first screens
The AI reader particularly outperformed when analyzing prevalent screens (women attending for the first time) compared to those who had been screened previously (termed ‘incident’ screens) (Fig. 2d). For these prevalent screens, the AI system achieved the lowest recall rate (7.1%, 95% CI: 6.7, 7.5) versus first human reader (11.8%, 95% CI: 11.3, 12.3) and consensus read (8.5, 95% CI: 8.0, 8.9), while also achieving the highest CDR (AI: 10.0 versus R1: 9.19 per 1,000; difference: 0.81, 95% CI: −0.03, 1.64). For incident cases, the AI achieved the highest CDR but also the highest recall rate. These results were largely consistent at the individual service level (Extended Data Fig. 3a–f).
Earlier diagnosis through outperformance on interval and next-round cancers
The AI system correctly identified 25.0% (95% CI: 20.4%, 30.0%) of future interval cancer cases, with 88.0% of these localized to the correct breast and 58.1% localized to the precise lesion. For next-round cancers that were only identified at the subsequent asymptomatic screening visit 3 years later, the AI system correctly identified 25.1% (95% CI: 22.1%, 28.1%) of cancer cases, again with 85.7% of cases correctly localized to the relevant breast and 53.1% localized to the precise lesion.
AI outperformed for women’s first screens and invasive cancers, with no concerning disparities across relevant clinical and sociodemographic subgroups tested in an exploratory analysis
We observed no notable differences in performance between the AI and the first human reader across the subgroups tested (Fig. 3). This included age, index of multiple deprivation, ethnicity and breast density. Two subgroups were borderline for sensitivity and failed noninferiority at a prespecified 5% margin, index of multiple deprivation (IMD) decile 1 (AI versus R1 difference: +0.070, 95% CI: −0.103, 0.244; n = 2,192) and mixed ethnicity (AI versus R1 difference: −0.048, 95% CI: −0.160, 0.000; n = 1,132), although both were groups with few positive cases, limiting the strength of statistical conclusions possible.

CIs for specificity are too small to visualize for many subgroups. Lesion size analysis considers the largest lesion for each case. Error bars represent the 95% CIs.
AI specificity was within a 5% noninferiority margin for all groups, with the exception of women attending screening for the first time and age group 50–54, where AI specificity was significantly higher. AI generally exceeded first human reader sensitivity, particularly for women over 65 years of age.
The distribution of disease detected with AI tended to favor higher-risk over lower-risk cancers. Compared to the first reader, the AI system achieved higher sensitivity for higher-risk cancers (0.55 versus 0.44; difference: 0.109, 95% CI: 0.083, 0.135; superiority P < 0.001) and noninferior sensitivity for lower-risk cancers (0.53 versus 0.47; difference: 0.052, 95% CI: −0.021, 0.125; noninferiority P = 0.003). For invasive cancers alone, the AI system achieved superior sensitivity compared to first, second and consensus decisions (0.54 versus 0.43, 0.46 and 0.46, respectively, P < 0.001 for all). When considering maximum lesion size per case, AI sensitivity performed favorably versus human readers across the range but especially outperformed for 20–30-mm lesions (Extended Data Fig. 4). Because of the low prevalence of cancer, CIs for many subgroups were large despite the large size of the study.
Performance was essentially consistent across Hologic, GE and Siemens devices included in the study. However, within Hologic, we noted that cases imaged using the newer Hologic Selenia Dimensions (n = 4,692) demonstrated a distribution shift compared to the older Hologic Lorad Selenia (n = 77,840), resulting in a higher recall rate of 10.9% (95% CI: 10.0, 11.8) versus 6.3% (95% CI: 6.1, 6.4). Full results are presented in Supplementary Table 2.
We assessed model calibration across different subgroups of interest (Extended Data Fig. 5a–f). Overall, there were no concerning disparities between subgroups within the range of the operating points (OPs) selected for this study. We noted that the Asian ethnicity and age 50–59 subgroups were somewhat overcalled compared to the others, although these were most evident at higher model OPs, outside of the range set for each site.
AI-enabled screening offers increased CDR with reduced reader time required, despite higher arbitration burden
We considered the clinical and operational effect of replacing one of the two historical readers before arbitration. Using AI as a second reader resulted in a 32.1% reduction in total reader time required (195,983 versus 288,616 equivalent reads), while CDR was increased by 17.7% (from 8.7 to 10.2 per 1,000) or 20.2% (from 8.5 to 10.2 per 1,000) for sites that arbitrate all recalls or arbitrate only discordances, respectively.
Overall, including cases unable to be processed by the AI, which retain their traditional double-read workflow, the number of total human screening reads performed before arbitration was reduced by 46.4% (133,943 versus 249,916 reads), while arbitration reads required were increased by 60.3% (12,408 versus 7,740 reads). Some services use radiographers to perform screening reads but not arbitration reads; thus, estimates of overall workforce cost will vary on the basis of local variation. An example cost sensitivity analysis across the range of model OPs is presented in Extended Data Fig. 6a.
The complementary nature of human and AI reading is highlighted in the detection patterns, with substantial but incomplete overlap between cancers identified by each approach (Extended Data Fig. 6b,c). Of the 40 cancers detected by human double reads but missed by the human + AI approach, 35 (88%) were deemed high risk. Of the 231 cases detected by the human + AI approach but missed by human double reads, 215 (93%) were deemed high risk. This suggests that the distribution of cancers is subtly shifted toward higher-risk tumor types when incorporating AI into the reading workflow.
Prospective observational deployment
Two screening services were included in the prospective deployment covering 12 screening sites across London. Characteristics of the dataset included are summarized in Table 2, with a data flow diagram in Extended Data Fig. 1b. In total, 43 women opted out of participating in the study. While not powered for significance, AI and human reader performance is shown in Fig. 4a,b.

a, The top segment (n = 45,653) reflects retrospective study cases from both screening services included for comparison, reanalyzed using the prospective study’s shorter 3-month ground truth. The middle segment (n = 3,678) reflects cases read at the initial deployment OP (OP1 until the OP update was performed). The bottom segment (n = 5,588) reflects cases read under the adjusted, more specific OP (OP2, latter 4 weeks). b, CDR versus recall rate, comparing the AI to human readers, using a within-episode ground truth (that is, for screen-detected cancers only, not including future interval cancers and those detected at the next round), across retrospective (n = 45,653), prospective at initial OP (n = 3,678) and prospective at adjusted OP (n = 5,588). c, Recall rate and CDR by week of the study. Dotted lines reflect performance had the Initial OP been continued for the remainder of the study. Error bars and shaded areas reflect the 95% CIs.
Adaptive OP selection
We implemented an iterative OP calibration process, setting initial thresholds on the basis of available historical data, followed by monitoring of recall rates, as described fully in the Methods. After approximately 2 weeks, we reviewed the initial metrics available including primarily recall rate. Service 1 had an AI recall rate of 11.3% (human first reader 3.8%), while service 2 had an AI recall rate of 12.3% (human first reader 5.3%). These were both above our target recall rates; thus, we adjusted the OP using the prospectively collected data. The second period of the study had AI recall rates for service 1 of 6.7% (human first reader: 4.7%) and service 2 of 10% (human first reader: 4.7%). There was substantial week-to-week variation in cohort, as shown in Fig. 4c, highlighting the challenges in detecting drift in this type of low-prevalence screening population.
Prospective deployment maintained accuracy despite a distribution shift
Across both sites, time from screen to completed AI read was 17.7 min (interquartile range (IQR): 8.5–37.6 min), while time from screen to first human read was 2.08 days (IQR: 1.00–3.81 days). Relative accuracy was maintained in the prospective deployment compared to the retrospective study (breast-level AUC: 0.98 for both; Extended Data Fig. 7a–f and Fig. 4a, top row versus second and third rows) when reanalyzing using a comparable ground-truth definition. When deployed at the screening sites, the initial OP was set to an overly sensitive threshold, resulting in a higher recall rate and associated lower specificity. This highlighted a distribution shift between the original data used to set the OP from 2016 and the newer deployment time period in 2023, with both human and AI being affected (Fig. 4b). Marked variations in cohort can be seen from observing AI and human performance data in week-to-week plots (Fig. 4c), highlighting the challenges in closely monitoring AI accuracy and safety after deployment.
Updated national guidelines and technical functionality would be required
The National Health Service (NHS) Breast Screening Programme (BSP) mandates a double-read workflow using human readers. In our AI-enabled workflow, an AI system replaces the second reader. However, as the AI cannot process all cases (for example, for cases that do not meet the intended use criteria or because of technical failure), the ability to invoke a human second reader remains necessary. At the time of the study, the National Breast Screening System (NBSS) software lacked functionality to automatically write back AI results and required an ‘assessment reason’ for recalls, which AI does not currently provide. Therefore, to ensure that the BSP is AI ready from a technical perspective, changes will be required to both national program guidelines and the IT system.
Local variation is currently widespread in screening
Despite elements of national standardization, the BSP allows for site-specific variability in other aspects of the workflow (Supplementary Table 4). This includes some flexibility in reading practices, devices and staffing allocations. This allows local services to adapt workflows to their unique circumstances such as local reading performance goals and staffing levels, which needs to also be considered for AI workflows.
Migration to digital workflows with strict data standardization will facilitate integration
An important factor for the feasibility of AI adoption is workflow digitization and standardization. At the time of research, eight of nine services interviewed relied on paper to drive the workflow (Supplementary Table 4). Readers relied upon client worksheets and physical processes to indicate which reading step was needed. Despite introducing redundancy and complexity, paper documentation was viewed as an important failsafe to check that the correct results were sent. AI cannot interact with physical documents; thus, full digitization would simplify an AI-enabled workflow (Extended Data Fig. 8). Furthermore, full standardization of workflow data collection (for example, including DICOM tags) would also facilitate AI integration. However, achieving this level of digitization will require extensive investment and effort.
Further details about the workflow design process are available in Supplementary Note 1.