Datasets construction
Development of the OrthologTransformer model required large-scale, high-quality ortholog datasets to accurately capture diverse genetic variations, including synonymous and non-synonymous substitutions, as well as insertions and deletions (indels). A strict separation between training and test datasets was also essential to rigorously evaluate model generalization. Initially, we processed sequence data from 2 to 132 bacterial species retrieved from RefSeq using OrthoFinder42. To ensure high data quality, sequences were restricted to lengths under 2100 bp, and only ortholog pairs with length ratios between 0.97 and 1.03 were selected. For constructing a larger and more comprehensive dataset, we leveraged the OMA database, which provides highly reliable ortholog data identified through rigorous algorithms. Distinct orthologous groups were allocated separately to training and testing sets, enabling accurate evaluation of the model’s predictive versatility. We partitioned ortholog groups such that no ortholog pair in the test set shares a protein with any pair in the training set. This means if a particular gene (or any genes from its species pair) was used for training, none of its orthologs or that gene itself appear in testing. The finalized training dataset comprised 1,071,976 orthologous groups and 4,971,060 ortholog pairs derived from 2138 bacterial species.
To further enhance dataset quality, we applied gap-processing by removing alignment gaps following amino acid alignments, thus preserving conservation in functionally important regions. Both gap-processed and unprocessed datasets were prepared to maintain a balance between evolutionary information retention and alignment quality.
For the test set, we deliberately selected species pairs with diverse GC contents and optimal growth temperatures to examine how biological characteristics impact conversion accuracy. This multifaceted approach enables OrthologTransformer to achieve robust and highly accurate predictions even for genes it has not encountered previously.
OrthologTransformer architecture
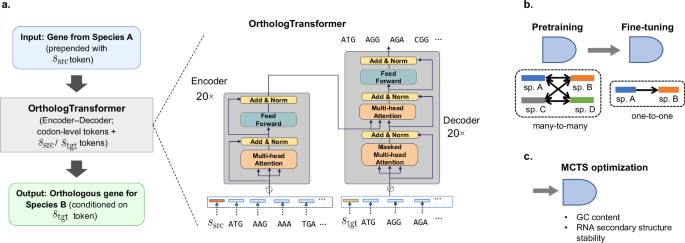
We present OrthologTransformer, a sequence‑to‑sequence (seq2seq) model specifically designed for cross‑species DNA sequence conversion (Fig. 1a). The model employs a Transformer architecture43 with a critical innovation: species‑conditioning tokens that encode the direction of conversion.
Species‑conditioning tokens: We prepend species identity tokens to the inputs to make the conversion direction explicit and to enable a single model to handle many source-target pairs with distinct sequence preferences. Concretely, the source token (\({s}_{{src}}\)) is prepended to the encoder input, and the target token (\({s}_{{tgt}}\)) is prepended to the decoder input, thus conditioning the model to learn directionality (e.g., converting a gene from species X to species Y) and is a deliberate design choice that allows a single model to handle multiple source-target species pairs.
Tokenization and embeddings: Input/output sequences are tokenized at codon resolution (three nucleotides per token). The vocabulary comprises 64 sense codons + start/stop + N species tokens (N is the number of distinct species used in training and test), and each token is mapped to a 512‑dimensional learnable embedding. Embeddings are randomly initialized and optimized end‑to‑end during training. The context length is 700 tokens, which corresponds to ~2.1 kbp when using codon tokens, since each token is 3 bases.
Model configuration and optimization. The architecture comprises 20‑layer encoder and 20‑layer decoder stacks (total 114,095,940 parameters) with 16‑head multi‑head attention and position‑wise feed‑forward networks in each layer (Supplementary Method 1). We train with cross‑entropy loss and the Adam optimizer using the following hyperparameters: embedding dimension 512, feed‑forward dimension 1024, dropout 0.0, batch size 64, and initial learning rate 0.0001.
Allowance of non‑synonymous substitutions and indels: Enabling amino‑acid‑changing edits and insertions/deletions (indels) is central to the biological task: many adaptive changes observed among natural orthologs require more than synonymous codon swaps, which synonym‑only codon optimization cannot capture. Accordingly, OrthologTransformer’s output space and training objective explicitly accommodate length and amino‑acid changes. During inference, the decoder generates codon tokens autoregressively and terminates upon an end‑of‑sequence condition, so insertions/deletions relative to the input emerge naturally.
Two-stage learning strategy
To obtain a single model that is both broadly transferable across bacteria and highly accurate for a specific engineering direction, we train OrthologTransformer in two stages (Fig. 1b).
Pretraining (many‑to‑many): We treat each ortholog pair as a directed sequence-conversion task from a source species (\({s}_{{src}}\)) to a target species (\({s}_{{tgt}}\)). Coding sequences are tokenized at codon resolution, and the conversion direction is explicitly encoded by prepending a source-species token to the encoder input and a target-species token to the decoder input; the vocabulary, therefore, consists of the standard codon tokens (plus start/stop) and one token per species. We optimize the model parameters by minimizing the token-level negative log-likelihood (cross-entropy) of the target coding sequence given the source sequence and the source/target species tokens across many-to-many source-target species combinations. Pretraining is performed on large multispecies ortholog corpora (ranging from small many-to-many sets up to the full OMA-based bacterial corpus). The largest pretraining set comprises 2138 bacterial species and 4,971,060 ortholog pairs (Supplementary Table 1).
Fine‑tuning (one‑to‑one): We specialize the pretrained model for a particular source-to-target direction (e.g., I. sakaiensis to B. subtilis) by continuing training on ortholog pairs restricted to that specific species pair only. Fine-tuning uses the same codon tokenization, species-conditioning scheme, and cross-entropy objective, but concentrates learning on the pair-specific genomic and translational context of the target host.
This two-stage regime addresses the practical limitation that any single species pair typically provides far fewer ortholog examples than a multispecies corpus, while still enabling strong performance for the specific conversion direction used in downstream design.
PETase sequence design
To generate B. subtilis-compatible PETase sequences from I. sakaiensis, we strategically initialized the decoder with the target species token \({s}_{{tgt}}\) concatenated with a codon-optimized signal sequence derived from the original PETase. This initialization guides the model toward generating sequences suitable for expression in the target organism. We implemented a comprehensive design strategy that explored multiple dimensions of sequence generation to create a diverse set of PETase variants (Table 2). Our approach systematically varied several key parameters: the source database (OrthoFinder or OMA) with corresponding variation in species diversity (ranging from 23 to 2138 species), whether training data underwent alignment preprocessing, whether the model underwent fine-tuning for the specific species pair, the application of MCTS for sequence optimization, and the choice of signal sequence (either codon-optimized or AI-designed). Regarding alignment preprocessing, we prepared both gap‑retained and gap‑removed datasets derived from amino‑acid multiple‑sequence alignments to balance conservation with edit visibility. This setup explicitly exposes the positions where natural orthologs introduce amino‑acid substitutions and indels (gaps), enabling the model to learn those patterns. This multifaceted approach allowed us to generate twelve distinct sequences that collectively represent different combinations of biological knowledge integration, computational optimization, and AI-driven design, enabling us to evaluate which factors most significantly influence successful heterologous expression.
Monte Carlo tree search optimization
We developed a MCTS algorithm to optimize generated sequences for both GC content and RNA secondary structure stability. This addresses the competing requirements of synthetic accessibility (favoring low GC content around 0.36) and functional mRNA stability (requiring stable secondary structures). Specifically, while lowering GC content facilitates DNA synthesis and cloning, maximizing translational output requires mRNA secondary structures stabilized to an optimal degree, extending transcript half-life without hindering ribosomal access44,45. Our MCTS implementation builds a search tree where each node represents a partial DNA sequence, with child nodes adding additional codons based on Transformer-generated probability distributions. We select the top three most probable tokens for expansion at each step. Node evaluation employs a reward function that balances GC content optimization with secondary structure stability:
$${{\rm{Reward}}}=\frac{10}{{100}^{\left|{{{\rm{GC}}}}_{{{\rm{generated}}}}-{{{\rm{GC}}}}_{{{\rm{target}}}}\right|}}+\frac{\left|{{\rm{MFE}}}\right|}{30}$$
(1)
where \({{{\rm{GC}}}}_{{{\rm{generated}}}}\) represents the sequence’s GC content, \({{{\rm{GC}}}}_{{{\rm{target}}}}\) equals 0.36, and \({{\rm{MFE}}}\) denotes minimum free energy (MFE) of the RNA structure. The algorithm iteratively performs selection using UCB146, expansion based on model probabilities, simulation to terminal states, and backpropagation of rewards, enabling efficient exploration of the sequence space while maintaining biological constraints. The weighting scheme used in the MCTS reward function and the corresponding hyperparameter details are provided in Supplementary Method 2.
Evaluation metrics
To comprehensively evaluate the sequences generated by our approach, we employed multiple metrics spanning sequence identity, structural prediction, and biological compatibility. For sequence evaluation, we calculated codon sequence identity by performing pairwise alignment using the Needleman-Wunsch algorithm with match score 1 and gap penalty 0, followed by normalization against sequence length. Similarly, we computed amino acid sequence similarity by pairwise alignment based on the BLOSUM score, applying gap penalties of 10 for opening and 0.1 for extension, with scores normalized by sequence length. For structural assessment, we utilized AlphaFold3 to compute TM-scores comparing predicted structures of AI-designed PETase variants against the wild-type PETase structure, providing quantitative evaluation of structural conservation. We also analyzed GC content, a critical parameter affecting both synthetic accessibility and thermal stability, ensuring compatibility with the target organism’s genomic characteristics. Translation efficiency was evaluated using the CAI, calculated as:
$${{{\rm{CAI}}}}=\exp \left(\frac{1}{L}\times \sum {{\mathrm{ln}}}{w}_{{ij}}\right)$$
(2)
ere L represents gene length in codons, and \({w}_{{ij}}\) denotes the relative adaptiveness of each codon, defined as:
$${w}_{{ij}}=\frac{{x}_{{ij}}}{{x}_{i\max }}$$
(3)
Here, xij represents the frequency of synonymous codon j for amino acid i, while \({x}_{i\max }\) indicates the maximum frequency among synonymous codons for the same amino acid i. We computed CAI values using whole-genome codon usage frequencies as reference data for each species, with values ranging from 0 to 1, where values closer to 1 indicate optimal codon usage for the target organism.
Structure prediction tools
Protein structure prediction
We used AlphaFold3 (ver. 3.0.1)47 to predict the 3D structures of the redesigned PETase variants, as well as the wild-type and codon-optimized PETase, for structural comparisons. The default AlphaFold3 pipeline was used for each sequence, and the top-ranked predicted model was selected for analysis.
We evaluated the predicted structures by calculating the TM-score and RMSD relative to the wild-type PETase structure. The per-residue pLDDT scores provided by AlphaFold3 were used to assess local model confidence. Additionally, the overall structural stability of each model was estimated using FoldX (ver. 4.0 Beta)48.
mRNA secondary structure prediction
We evaluated mRNA secondary structure for each designed sequence using the ViennaRNA package version. 2.6.4 (RNAfold)49. We computed the MFE structure for the full mRNA sequence and recorded the MFE value as a measure of mRNA folding strength. This was done to compare whether our designs had potentially more favorable (less stable, thus more easily unwound) mRNA structures than the originals.
dN/dS analysis procedure
For each orthologous group, we selected close homologs (≥90% identity) using the source and target sequences as anchors and generated an amino-acid multiple sequence alignment, which was mapped to coding sequences to obtain a codon-sequence alignment. A phylogeny was inferred for FEL30, and HyPhy FEL was used to estimate site-wise nonsynonymous (dN) and synonymous (dS) substitution rates; sites showing significant evidence of purifying selection (p < 0.01 and dN/dS < 1) were classified as “purifying”, whereas sites with dN/dS ≥ 1 or without significant purifying signal were classified as “non-purifying”.
Experimental procedures
Strain construction
Synthesized genes and the expression vector (E. coli/B. subtilis shuttle vector pUC980-250, refer to Supplementary Method 3) were amplified by PCR (Oligonucleotide sequences of primers used in this study are provided in Supplementary Data 3). The resulting DNA fragments were mixed at a 1:1 molar ratio (vector:gene) and assembled using NEBuilder HiFi DNA Assembly Master Mix (New England Biolabs, USA). After incubation at 50 °C for 30 min, the assembled DNA was transformed into E. coli HST08 (Takara, Japan), and plasmids were subsequently extracted. These plasmids were then transformed into B. subtilis RM12551 using a competence-based transformation protocol52, and transformants were selected on LB agar containing kanamycin (25 µg/mL). The strains and plasmids used or constructed in this study are listed in Supplementary Data 1.
RNA extraction and reverse transcription
Recombinant B. subtilis cells were harvested during the logarithmic growth phase (Supplementary Fig. 11) by centrifugation at 5800 × g for 3 min (refer to Supplementary Method 4 for details). Three biological replicates were prepared for each recombinant strain. The cells were resuspended in 100 μL of a 5 mg/mL lysozyme solution prepared in 1× TE buffer and incubated at 37 °C for 10 min. RNA extraction was performed using the NucleoSpin RNA kit (Macherey-Nagel, Germany) according to the manufacturer’s instructions. Total RNA was quantified and assessed for quality using the RNA 6000 Nano Kit on an Agilent 2100 Bioanalyzer (Agilent Technologies, USA). All samples exhibited an RNA integrity number (RIN) greater than 9.8. Reverse transcription of total RNA was performed using the ReverTra Ace qPCR RT Master Mix with gDNA Remover (Toyobo Co., Ltd., Japan) according to the manufacturer’s guidelines.
PCR for full-length transcript
PCR was then performed using a forward primer binding near the 5′ end of the PETase coding sequence (within the signal peptide region) and a reverse primer at the 3′ end (within the His-tag region) (refer to Supplementary Method 5 for primer design and Supplementary Data 3 for oligonucleotide sequences). Amplification was performed using PrimeSTAR Max DNA Polymerase Ver.2 (Takara, Japan), with the following thermal cycling conditions: 20 cycles of 98 °C for 10 s, 55 °C for 10 seconds, and 68 °C for 5 s. The expected amplicon was visualized on agarose gel. All PETase constructs yielded the correct band from cDNA, confirming presence of full-length mRNA.
Quantitative real-time PCR (qPCR)
For quantification of PETase transcripts, we performed qPCR on a StepOne Plus Real-Time PCR System (Thermo Fisher Scientific, USA) with Power SYBR Green PCR Master Mix (Applied Biosystems, USA). Gene-specific primers were designed to amplify an internal region within the signal sequence of PETase gene, which is common to all recombinant strains (refer to Supplementary Method 5 for primer design and Supplementary Data 3 for oligonucleotide sequences). As an internal control, primers for the single-copy gyrA gene of B. subtilis (DNA gyrase subunit A) were used. The ΔCt for PETase was calculated relative to gyrA, and then expression levels were normalized to the WT (wild-type) PETase sample (set as 1.0) using the ΔΔCt method.
Western blotting (immunoblot)
To detect PETase protein, recombinant B. subtilis cells were grown in LB medium supplemented with 1% xylose and 25 μg/ml kanamycin at 30 °C for 12 h, and samples of both the culture supernatant and cell pellet were collected. For the supernatant, 1 mL of culture was centrifuged (5800 × g, 5 min, 4 °C) to remove cells, and the supernatant was mixed with 6× sample loading buffer. All samples were normalized by culture volume (since cell density was similar across strains at 24 h), and boiled (5 min, 95 °C) before SDS-PAGE. Proteins were separated on 12.5% SDS-PAGE gels. For secreted proteins, we loaded 9.0 µL of culture supernatant samples directly. After electrophoresis, proteins were transferred to a PVDF membrane. The membrane was probed with an anti-polyhistidine monoclonal antibody (Proteintech, Cat# 66005-1-Ig, Lot# 1B7G5, 1:5000 dilution) against the 6×His-tag at PETase C-terminus, followed by an Alkaline Phosphate-conjugated secondary antibody (Proteintech, Cat# SA00002-2, 1:2000 dilution). Detection was performed with BCIP/NBT and recorded on an imager. A His-tagged protein ladder was used to verify molecular weight.
Enzyme kinetics (kcat and Km) in vitro
Measurement of the enzymatic activity on the degradation of BHET (Bis (2-hydroxyethyl) Terephthalate) to the breakdown product MHET (mono (2-hydroxyethyl) terephthalate) was performed by HPLC analysis of the decrease of BHET as substrate after 2-h incubation at 30 °C. The specific activity was defined as the amount of enzyme needed for hydrolyzing 1 mmol of BHET per hour. Kinetic parameters Km and Vmax were determined using the corresponding substrate at concentrations from 0.1 mM to 3 mM under the same reaction conditions as described for substrate specificity determination. Kinetic parameters were derived from the Michaelis-Menten equation. All enzymes were purified using Capturem TM his-tagged purification maxiprep columns (Takara, Japan) and removing contaminating proteins using Nanosep (PALL, Japan), following the manufacturer’s instructions. The protein concentration was determined using the Bradford kit (ATTO, Japan).
PETase activity assessment
PET film degradation experiment
Additive-free PET film (thickness ~0.25 mm) was cut into ~20 cm² pieces (4 cm × 5 cm rectangles). Before use, the films were thoroughly washed with 1% (w/v) sodium dodecyl sulfate (SDS) for 30 min and rinsed with Milli-Q water, to remove any contaminants and surface treatments. Films were then soaked in 70% ethanol for 1 h for sterilization and air-dried in a laminar flow hood. Each PET film piece was placed in a 50 mL Erlenmeyer flask containing 20 mL of LB medium with kanamycin (25 µg/mL). B. subtilis transformant pre-cultures were grown overnight in LB medium containing kanamycin (25 µg/mL) at 30 °C, and 200 µL of the overnight culture was used to inoculate the flask (initial OD ~ 0.1). 1% xylose was added at inoculation to induce PETase expression from the start. Cultures with PET film were incubated at 30 °C, 180 r/min for up to 7 days. Flasks were covered but not sealed (to allow aeration). At predetermined time points (24 h, 48 h, 72 h, and 7 days), 0.5 mL of culture medium was sampled for HPLC analysis of PET degradation products, using the same protocol as for BHET samples. Because PET is solid and only its soluble hydrolysis products are in the medium, we focused on MHET and TPA detection. BHET was not expected unless PET hydrolysis stops at dimer stage (which PETase typically does not). Each assay was done in triplicate flasks for each strain. After 7 days, the PET film was recovered from the culture for imaging.
HPLC quantification of PET hydrolysis products
Culture supernatants from PET film flasks were processed as for BHET (Bis (2-hydroxyethyl) Terephthalate) samples (acetonitrile/formic acid quench and centrifugation). The HPLC analysis was identical. We confirmed linearity of MHET detection in the relevant range (0–3 mM) by running standard solutions. In control flasks (no PETase), no MHET or TPA peaks were observed at any time point. In PETase-expressing samples, a clear MHET peak emerged by day 2–3. MHET concentration was quantified for each sample. TPA was not observed (likely remaining bound in undetectable form or not produced due to lack of MHETase). The results were plotted as MHET (µM) released per flask over time. Statistical comparison of MHET at day 3 among strains was performed by one-way ANOVA with Dunnett’s multiple comparisons. AI-L2 produced significantly more MHET than all other strains (p < 0.0001 for AI-L2 vs each other PETase strain). These quantitative data corroborate the qualitative ranking of enzyme performance.
Scanning electron microscopy (SEM)
After 7 days of incubation, PET film pieces were retrieved from the cultures with sterile tweezers. To remove attached cells and biofilm, each film was gently sonicated in 2% SDS solution for 5 min, then rinsed thoroughly with Milli-Q water (several dips). Films were then air-dried completely (Supplementary Method 6). The specimens were then plasma-coated with osmium for 5 s using an osmium coater (HPC-20, Vacuum Device) to prevent charging. Images were acquired using an Inspect S50 scanning electron microscope (FEI) operated with the xT microscope control software. The accelerating voltage was set at 12.5 kV with a working distance of 10 mm. No further image processing or manipulations were performed after acquisition. Images were taken at 10,000× magnifications. We focused on 10,000× for detailed surface features. Multiple fields were imaged for each film. The control film showed a smooth surface with machining striations but no biological etching. Treated films showed various degrees of erosion: we observed pits, grooves, and in some cases, large holes that appear to correspond to where a bacterial cell was attached (as inferred by size and shape). These SEM results visually confirm PET hydrolysis and were consistent across triplicate samples.
Experiment in a Gram-negative host (Escherichia coli)
For the E. coli experiments, strain construction, RNA extraction and reverse transcription, Western blotting, and PETase activity assessment were performed following the same protocols as those used for B. subtilis. Details are provided in Supplementary Method 7.
Statistics and reproducibility
For the large-scale benchmark shown in Fig. 3, each plotted value represents the mean codon-level sequence identity across 10 source-to-target conversions per target species (n = 10), with error bars indicating the standard deviation. OrthologTransformer was compared against baseline methods using predefined evaluation metrics, including codon-level sequence identity, CAI proximity, and GC alignment. Statistical significance for pairwise method comparisons was assessed using a two-sided paired t-test where applicable, while Fisher’s exact test was used for categorical comparisons, such as enrichment of significant groups. Reported p values are provided in the corresponding Supplementary Tables.
Data were analyzed using ordinary one-way ANOVA to compare across the 15 experimental groups in Fig. 6b. The assumption of equal variance was confirmed by the Brown-Forsythe test (P = 0.3978). Following the ANOVA, post-hoc comparisons were carried out using Dunnett’s multiple comparisons test to determine significant differences between specific groups. Statistical analyses were performed using GraphPad Prism, v10.1.0.
No statistical method was used to predetermine sample size.
All computational analyses were performed using custom Python scripts and are reproducible given the same input data and parameters. Source code and datasets are available as described in the Code Availability and Data Availability statements.
All unique strains and plasmids generated in this study are available from the corresponding author upon reasonable request.
Reporting summary
Further information on research design is available in the Nature Portfolio Reporting Summary linked to this article.